All Features
Every Feature, Explained in Detail
A complete overview of everything the DataToBrief platform offers — from deep research and AI chat to document intelligence, earnings tracking, and team collaboration.
Deep Research
Institutional-Grade Research in Minutes, Not Days
Our AI doesn't just summarize — it synthesizes. Deep Research reports analyze up to 14 data source types simultaneously — from 10 years of income statements to the latest earnings call transcript — and produce 8,000 to 12,000 word reports with the structure and depth of a sell-side initiation.
14 Selectable Data Sources
Choose exactly which data feeds into your report: income statements (annual & quarterly), balance sheets, cash flow, key metrics & ratios, earnings transcripts, stock news, press releases, SEC filings (10-K, 10-Q, 8-K), analyst estimates, and price targets.
Mandatory Report Structure
Every report follows an institutional template: Executive Summary, Company Overview with snapshot table, Financial Analysis (income, balance sheet, cash flow), Key Financial Ratios table, Industry & Competitive Position (Porter's Five Forces), Recent Developments, Risk Factors (8–10 minimum), Valuation with DCF reasoning & peer comparison, and Bull/Base/Bear scenarios with target prices.
Attach Your Own Documents
Upload internal memos, proprietary models, Excel files, or PDF presentations. AI incorporates your private data alongside public financial data for a complete analysis.
Flexible Date Ranges
Analyze the last month, quarter, year, 2 years, 5 years, or full 10-year history. Wider ranges pull more quarterly data, more earnings transcripts, and more filings for deeper analysis.
Professional PDF Export
Export any research report to a cleanly formatted PDF — ready to share with your team, investment committee, or compliance department.
10 Output Languages
Generate reports in English, Dutch, German, French, Spanish, Chinese, Japanese, Korean, Portuguese, or Italian. Perfect for international teams and cross-border mandates.
Investment Monitors
Thesis-Driven Monitoring That Works While You Sleep
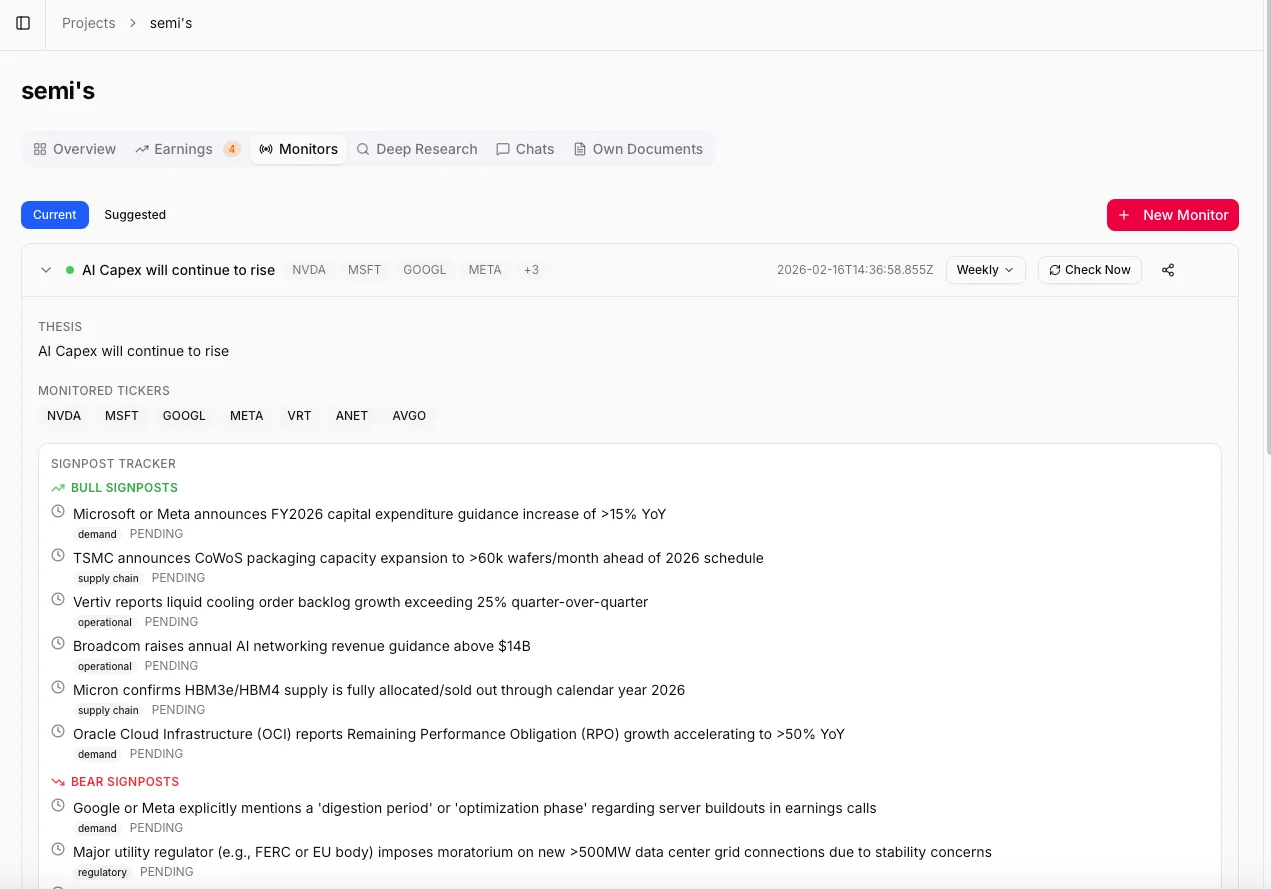
Describe your investment thesis in plain language. Our AI builds a complete monitoring framework: it suggests relevant tickers, identifies related companies across the supply chain, and generates 8–12 bull and bear signposts. Then it monitors everything — daily, weekly, or monthly — and tells you what changed and why it matters.
3-Step AI Setup
Describe your thesis, and AI does the rest: (1) suggests 5–8 relevant tickers plus 3–5 related companies (supply chain, competitors, customers), (2) generates a comprehensive 90-day initial summary with thesis scorecard, and (3) creates 8–12 bull/bear signposts to track automatically.
Bull & Bear Signposts
Each monitor tracks specific events that would confirm or challenge your thesis — categorized as supply chain, competitive, regulatory, demand, macro, or operational. Signposts automatically update their status (pending, triggered, invalidated) as evidence emerges.
Cross-Company Intelligence
Monitors don't just track your target companies. They analyze supply chain partners, competitors, and customers for cross-reference signals. A supplier's earnings miss or a competitor's product launch gets flagged automatically.
Configurable Check Frequency
Daily checks scan news and press releases for quick updates. Weekly and monthly checks perform deep analysis across all data sources — earnings, filings, metrics, and cross-company signals — for comprehensive thesis assessment.
7 Update Categories
Every signal is categorized: news, earnings highlights, SEC filing insights, press release analysis, signpost triggers, cross-references from related companies, and significant metric changes compared to the previous period.
Impact & Materiality Scoring
Each update is scored 1–5 for materiality and tagged as 'confirms thesis', 'challenges thesis', or 'neutral'. At a glance, you see whether your thesis is strengthening, unchanged, or weakening.
Interactive Canvas
Your Bloomberg-Like Research Dashboard
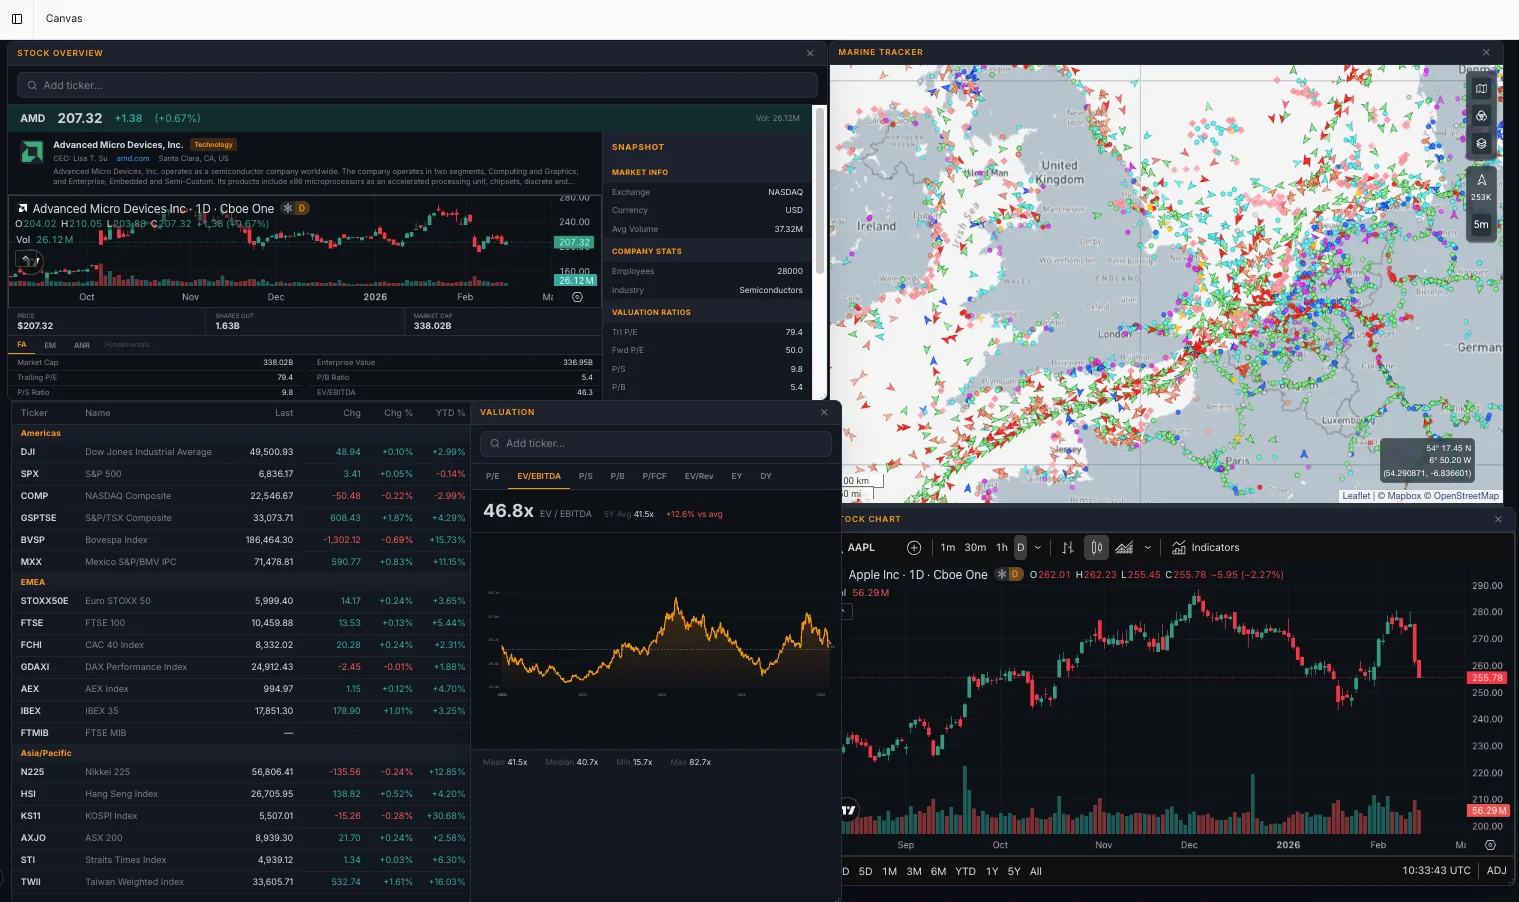
A fully customizable, multi-window workspace inspired by professional trading terminals. Drag, drop, and resize widgets to build the perfect research dashboard. Track 19 global indices, view TradingView charts with full technical analysis, monitor your watchlists, and analyze financial ratios — all in one view.
7 Powerful Widget Types
Build your workspace from: Watchlists (live quotes, auto-refresh every 15s), TradingView Charts (full technical analysis), World Indices (19 markets across Americas, EMEA, Asia-Pacific), Financial Ratios (multi-year trends), Valuation Multiples (P/E, P/S, P/B, EV trends), Stock Overview (complete company snapshot), and more.
19 Global Equity Indices
Real-time data for Dow Jones, S&P 500, NASDAQ, TSX, Bovespa, Euro STOXX 50, FTSE 100, CAC 40, DAX, AEX, IBEX 35, FTSE MIB, Nikkei 225, Hang Seng, KOSPI, ASX 200, and more. Click any index to open a dedicated TradingView chart window.
TradingView Integration
Full TradingView advanced charts with technical analysis tools, multiple timeframes, indicator overlays, and chart type selection — candlestick, line, or area. All directly within your canvas.
Persistent Workspace
Your window layout, positions, sizes, and widget settings are automatically saved and restored every time you return. Build it once, use it every day.
Command Bar
Press the backtick key to instantly search and spawn any widget. Build your entire workspace in seconds with keyboard shortcuts.
Live Watchlists
Create custom watchlists with auto-refreshing quotes every 15 seconds. Track last price, daily change, YTD performance, and volume for every ticker you follow.
AI Research Chat
Ask Questions. Get Answers Backed by Real Data.
Chat with your financial data like you'd talk to a senior analyst. Select specific companies and data sources, ask complex investment questions, and get detailed answers drawn directly from earnings calls, SEC filings, financial statements, and market data. Every answer links back to the original source.
Company-Specific Context
Select one or more companies and choose which data sources to include before chatting. AI accesses real earnings transcripts, SEC filings, financial statements, analyst estimates, and news to answer your questions — not generic knowledge.
Multi-Turn Conversations
Chat remembers your full conversation history. Ask follow-up questions, drill into specifics, or change direction without repeating context. Like working with an analyst who remembers everything.
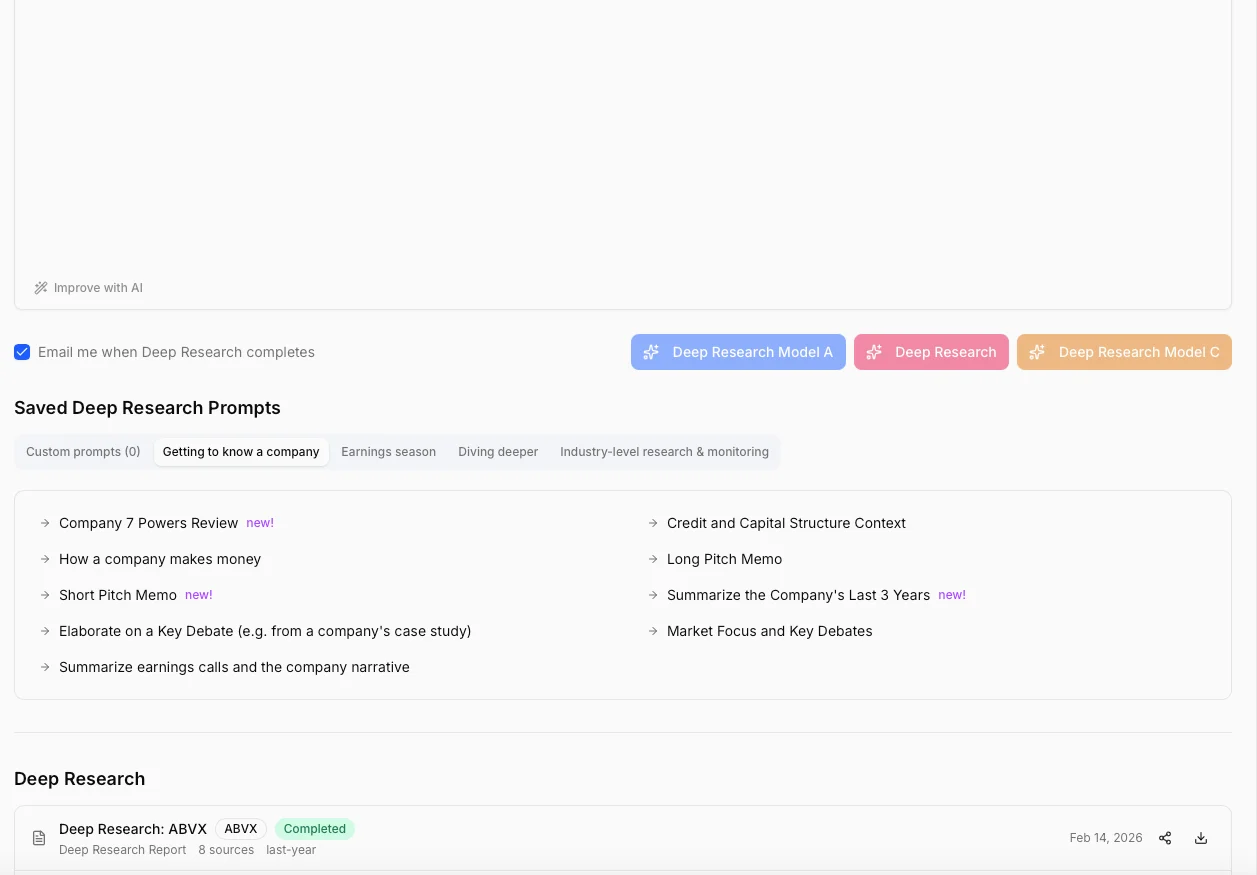
Saved Prompt Templates
Save your best research questions as reusable templates. Standardize your research process across your team — everyone asks the right questions consistently.
Share to Team
Found a valuable insight? Share any chat message directly to your team's project chat with one click. Your colleagues see the full context with a rich preview card.
Streaming Responses
Answers appear in real-time as AI processes your question. For complex multi-source queries, you see the reasoning unfold rather than waiting for a complete response.
Company Intelligence
10 Years of Financial Data at Your Fingertips
Every company in your project gets a dedicated intelligence page with 10 years of financial statements, interactive charts, earnings history, key ratios, and a live news feed. Click any metric to instantly generate a visual chart with CAGR calculations.
Interactive Financial Statements
10 years of income statements, balance sheets, and cash flow data in clean tables. Click any metric row — revenue, net income, free cash flow — to instantly chart it with CAGR and total change calculations.
Stock Price Charts
Historical price data across 11 timeframes: 1D, 5D, 1M, 3M, 6M, YTD, 1Y, 3Y, 5Y, 10Y, and MAX. Interactive area charts with percentage change indicators and gradient styling.
Key Ratios Dashboard
8 essential ratios at a glance: P/E, Price/Sales, Price/Book, Debt/Equity, Current Ratio, ROE, ROA, and Dividend Yield. Click any ratio card to view the full 10-year trend as an interactive chart.
Earnings History & Surprises
Up to 20 quarters of earnings data showing actual vs. estimated EPS and revenue. Visual beat/miss chart with color-coded bars. See exactly when companies exceeded or missed Wall Street expectations.
Live News & Press Releases
Real-time company-specific news articles and official press releases directly on the company page. Stay current without switching between tools.
Document Intelligence
Your Documents, Supercharged by AI
Upload your own proprietary documents — internal memos, financial models, competitor analyses, board presentations — and let AI incorporate them into your research. Combine private data with public financial data for a complete picture.
Wide Format Support
Upload PDF, Word (.doc, .docx), Excel (.xlsx, .xls), CSV, JSON, XML, HTML, Markdown, and plain text files. AI extracts and indexes the content for analysis.
Integrated with Deep Research
Attach uploaded documents directly to Deep Research requests. AI cites your internal documents alongside public SEC filings, earnings transcripts, and financial data in the final report.
Built-in Document Viewer
Preview PDFs directly in the platform with page navigation and zoom controls. No need to download files or switch applications.
Project-Based Organization
Documents are organized per project. Centralized document hub shows everything across all projects with quick filtering and management tools.
Earnings Tracking
Never Miss an Earnings Date Again
Automatic earnings calendar for every company in your projects. See upcoming dates, actual vs. estimated EPS and revenue, historical surprise data, and full earnings call transcripts — all in one view.
Earnings Calendar
Automatically tracks upcoming earnings dates for all companies in your project. See time of reporting (before/after market), estimated EPS, and estimated revenue at a glance.
Surprise Analysis
Visual charts showing actual vs. estimated EPS across 20+ quarters. Color-coded beats (green) and misses (red) make it easy to spot patterns in management's ability to meet expectations.
Full Transcripts
Access complete earnings call transcripts including prepared remarks and Q&A sessions. Use them as context in Deep Research reports or AI Chat conversations.
Team Collaboration
Built for Investment Teams, Not Solo Analysts
Invite your team to shared projects, collaborate in real-time, and preserve institutional knowledge. Every piece of research, every monitor update, every document is shareable with one click.
Project-Based Teams
Invite team members to specific projects. Everyone gets access to shared research, monitors, documents, and AI chats. Roles (owner/member) control who can manage settings.
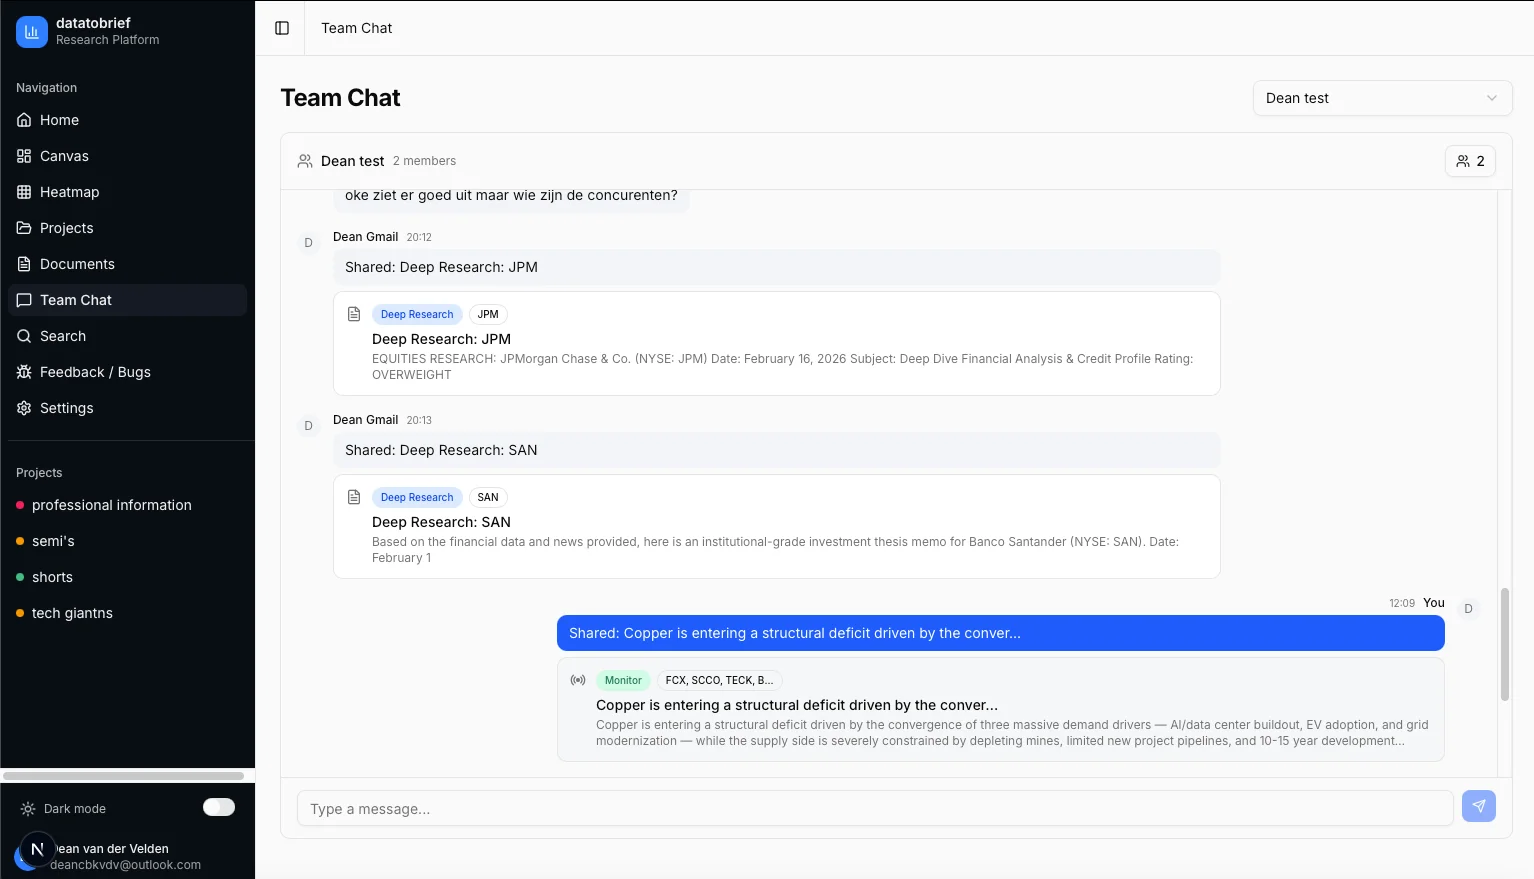
Real-Time Team Chat
Dedicated chat per project plus cross-project group chats. Share deep research reports, monitor updates, and documents inline with rich preview cards.
Share Anything, Instantly
One-click sharing from anywhere in the platform. Share a research report finding, a monitor alert, or a chat insight — your team sees it immediately with full context.
Institutional Knowledge
When an analyst leaves, their research stays. All reports, monitors, chat history, and documents remain in the project — preserving years of institutional knowledge.
Data & Integrations
All the Financial Data You Need, Automatically Aggregated
Comprehensive data from trusted sources — integrated into every report, monitor, and chat. No manual data gathering required.
Income Statements
Up to 10 years annual + 40 quarters
Balance Sheets
Complete assets, liabilities & equity
Cash Flow Statements
Operating, investing & financing flows
SEC Filings
10-K, 10-Q, 8-K — full text access
Earnings Transcripts
Full call transcripts with Q&A sections
Analyst Estimates
Consensus EPS & revenue estimates
Key Metrics & Ratios
200+ ratios: P/E, ROE, D/E, and more
News & Press Releases
Real-time company-specific news feeds
Price Targets
Analyst price targets & consensus
Stock Prices
Historical OHLCV data, all timeframes
Company Profiles
Sector, industry, CEO, employee count
Global Indices
19 indices across 3 regions, real-time
Settings & Controls
Full Control Over Your Platform
Usage Dashboard
Track API costs by provider, view token usage, and monitor spending trends. Full transparency on every AI request.
Budget Controls
Set monthly spending limits per user. Warning thresholds at configurable percentages. Automatic blocking when limits are reached.
Admin Panel
Manage users, set budgets, view platform-wide analytics, and handle support tickets. Full control for team administrators.
Multi-Language UI
Platform interface available in 5 languages (English, Dutch, German, French, Spanish). Report output in 10 languages — configured separately.
Enterprise-Grade Security
Your data is protected with row-level security, encrypted storage, and European data practices. Complete data isolation between organizations. Per-user budget controls and usage monitoring. Built for the compliance requirements of European investment firms.
Learn more about our security →Ready to transform your research workflow?
Join select investment teams already using DataToBrief.
We respect your privacy. No spam.