Product Tour
See Exactly What You Get
Walk through every feature of the DataToBrief platform step by step. From organizing your research to collaborating with your team — this is what your workflow looks like on day one.
8 stops
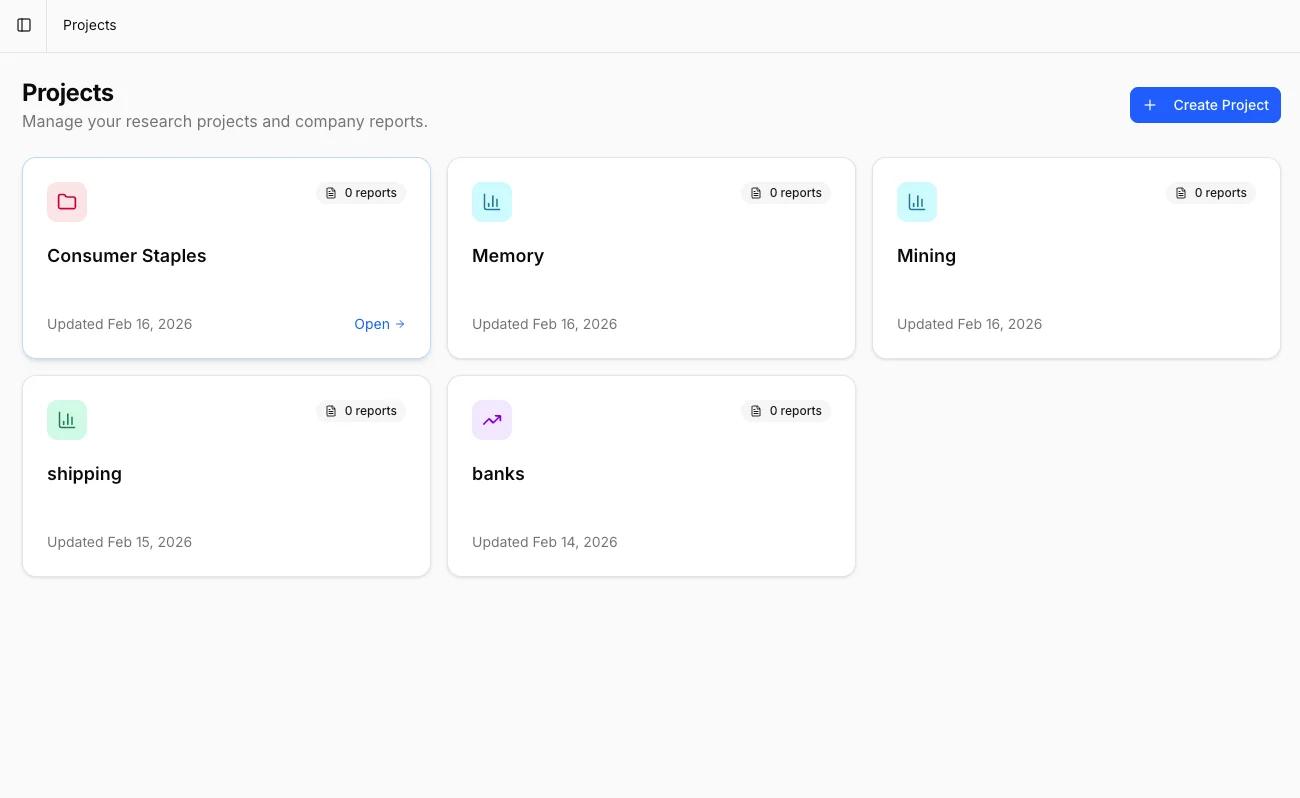
Projects
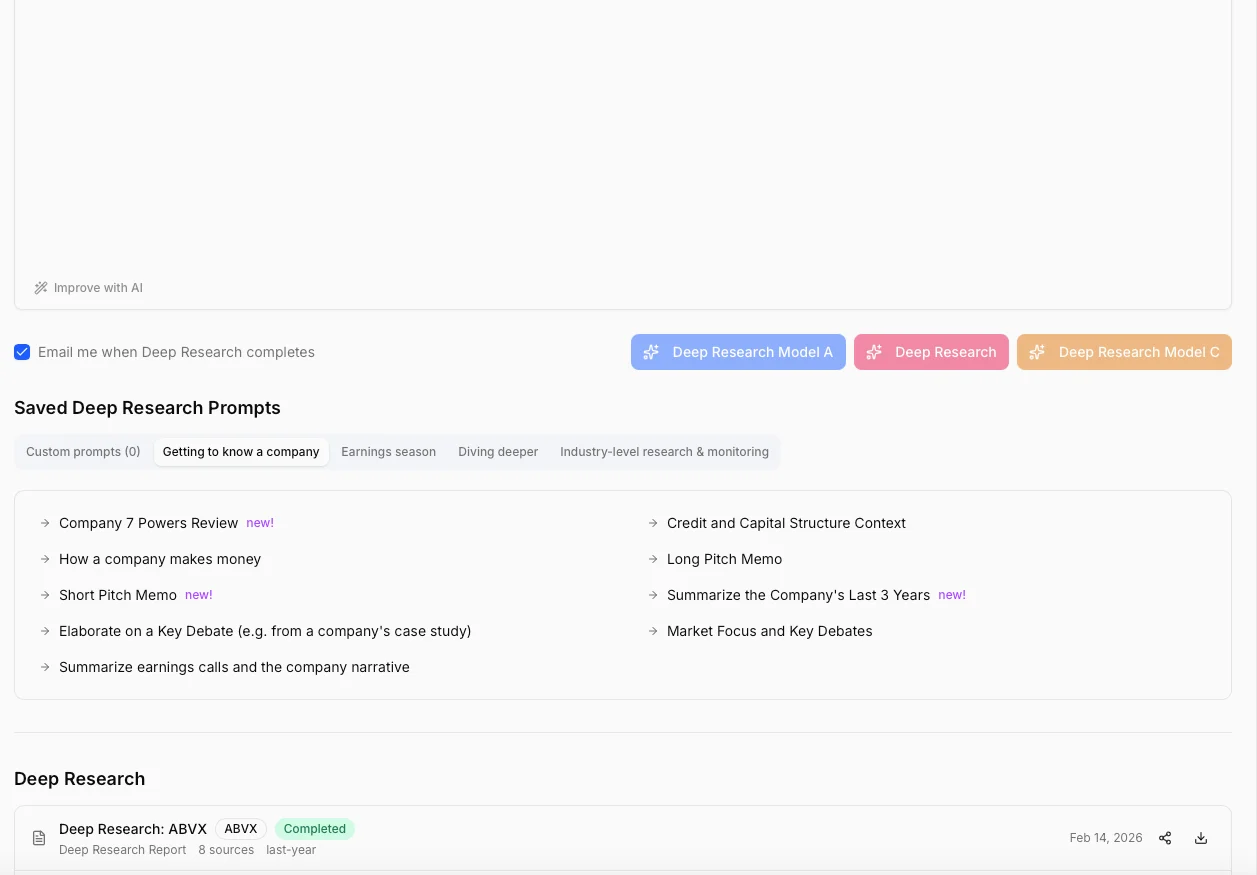
02Deep Research
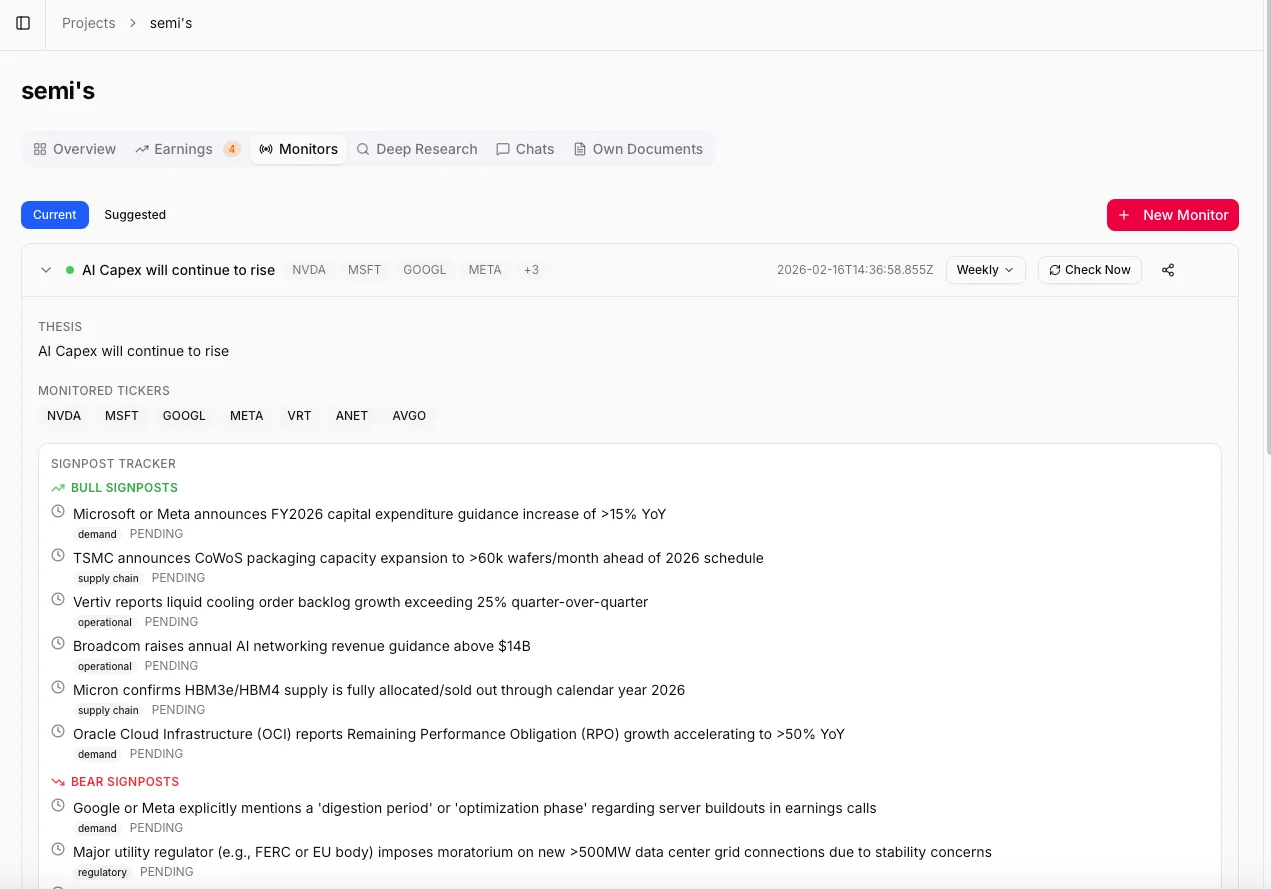
03Investment Monitors
04Company Intelligence
05AI Chat
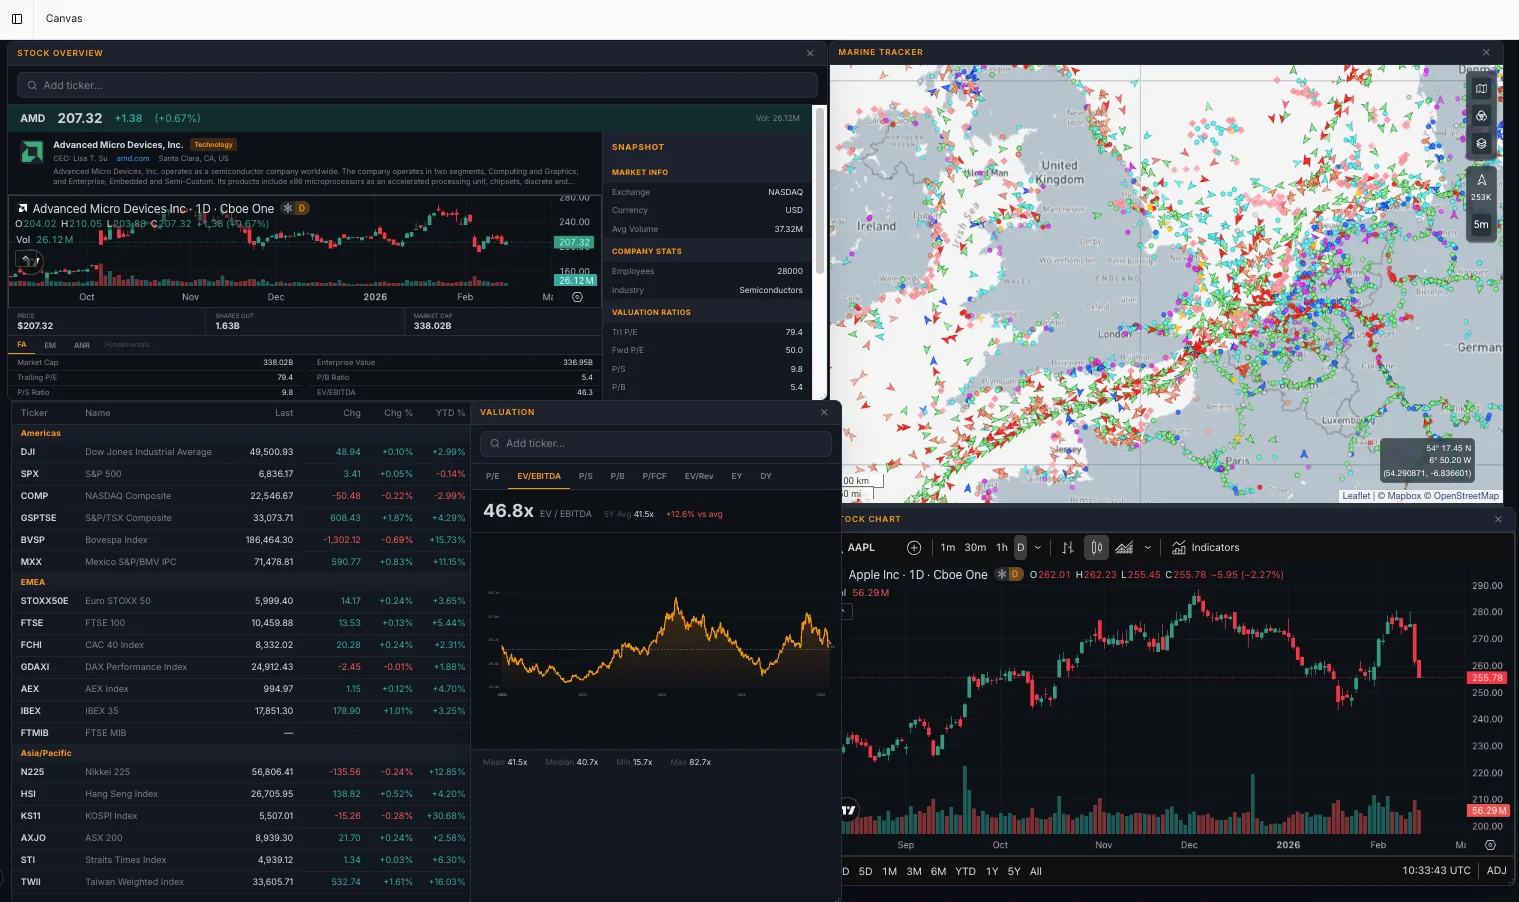
06Canvas
07Documents
08Team Collaboration
Your Research, Organized
Every investment thesis starts with a Project. Projects are your dedicated workspaces — each one brings together companies, monitors, research reports, AI chats, and documents into a single organized hub. Add tickers, invite team members, and keep everything related to a specific investment theme in one place.
Dedicated workspace per investment theme or portfolio
Six integrated tabs: Overview, Earnings, Monitors, Deep Research, Chats, and Documents
Add any publicly traded company by ticker symbol
Invite team members with role-based access control
12,000+ Word Reports in Minutes
Generate institutional-grade research reports with a single click. Our AI analyzes up to 14 data source types simultaneously — from 10 years of income statements to the latest earnings call transcript — and produces 8,000 to 12,000 word reports with the structure and depth of a sell-side initiation.
14 selectable data sources including financials, filings, and transcripts
AI-enhanced prompts that improve your research questions automatically
Professional PDF export ready for your investment committee
Generate reports in 10 languages for international teams
AI That Watches the Market For You
Describe your investment thesis in plain language and our AI builds a complete monitoring framework. It suggests relevant tickers, identifies related companies across the supply chain, and generates 8–12 bull and bear signposts. Then it monitors everything — daily, weekly, or monthly — and tells you what changed and why it matters.
Input your thesis and AI generates bull/bear signposts automatically
Signpost tracker with real-time status: pending, triggered, or invalidated
Configurable check frequency: daily, weekly, or monthly deep analysis
Cross-company intelligence from supply chain, competitors, and customers
Everything About Any Company
Every company in your project gets a dedicated intelligence page with 10 years of financial statements, interactive charts, earnings history, key ratios, and a live news feed. Click any metric to instantly generate a visual chart with CAGR calculations.
10 years of income statements, balance sheets, and cash flow data
Interactive stock price charts across 11 timeframes
8 key ratios at a glance: P/E, ROE, ROA, and more
20 quarters of earnings history with beat/miss visualization
10 years of income statements, balance sheets, and cash flow data
Interactive stock price charts across 11 timeframes
8 key ratios at a glance: P/E, ROE, ROA, and more
20 quarters of earnings history with beat/miss visualization
Ask Anything, Get Data-Backed Answers
Chat with your financial data like you'd talk to a senior analyst. Select specific companies and data sources, ask complex investment questions, and get detailed answers drawn directly from earnings calls, SEC filings, financial statements, and market data. Every answer links back to the original source.
Context-aware: select companies and data sources before chatting
Save your best research questions as reusable prompt templates
Multi-turn conversations that remember your full chat history
Context-aware: select companies and data sources before chatting
Save your best research questions as reusable prompt templates
Multi-turn conversations that remember your full chat history
Build Your Perfect Dashboard
A fully customizable, multi-window workspace inspired by professional trading terminals. Drag, drop, and resize widgets to build the perfect research dashboard. Track 19 global indices, view TradingView charts with full technical analysis, monitor your watchlists, and analyze financial ratios — all in one view.
Command bar: press backtick to instantly search and spawn any widget
8 widget types: watchlists, charts, indices, ratios, valuations, and more
Persistent layout that saves and restores automatically
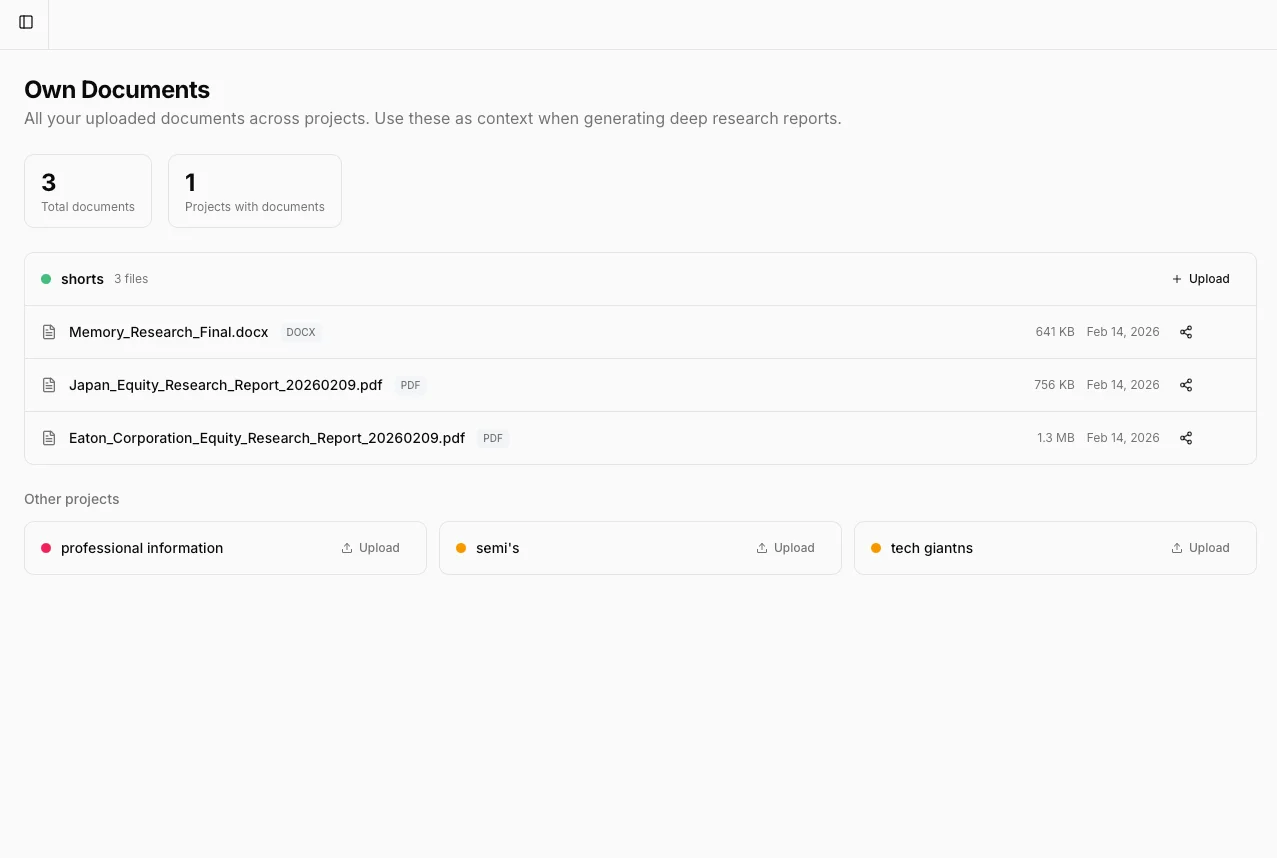
Bring Your Own Data
Upload your own proprietary documents — internal memos, financial models, competitor analyses, board presentations — and let AI incorporate them into your research. Combine private data with public financial data for a complete picture.
Upload PDF, Word, Excel, CSV, JSON, XML, HTML, Markdown, and plain text
AI uses your documents as context in Deep Research and Chat
Built-in document viewer with page navigation and zoom
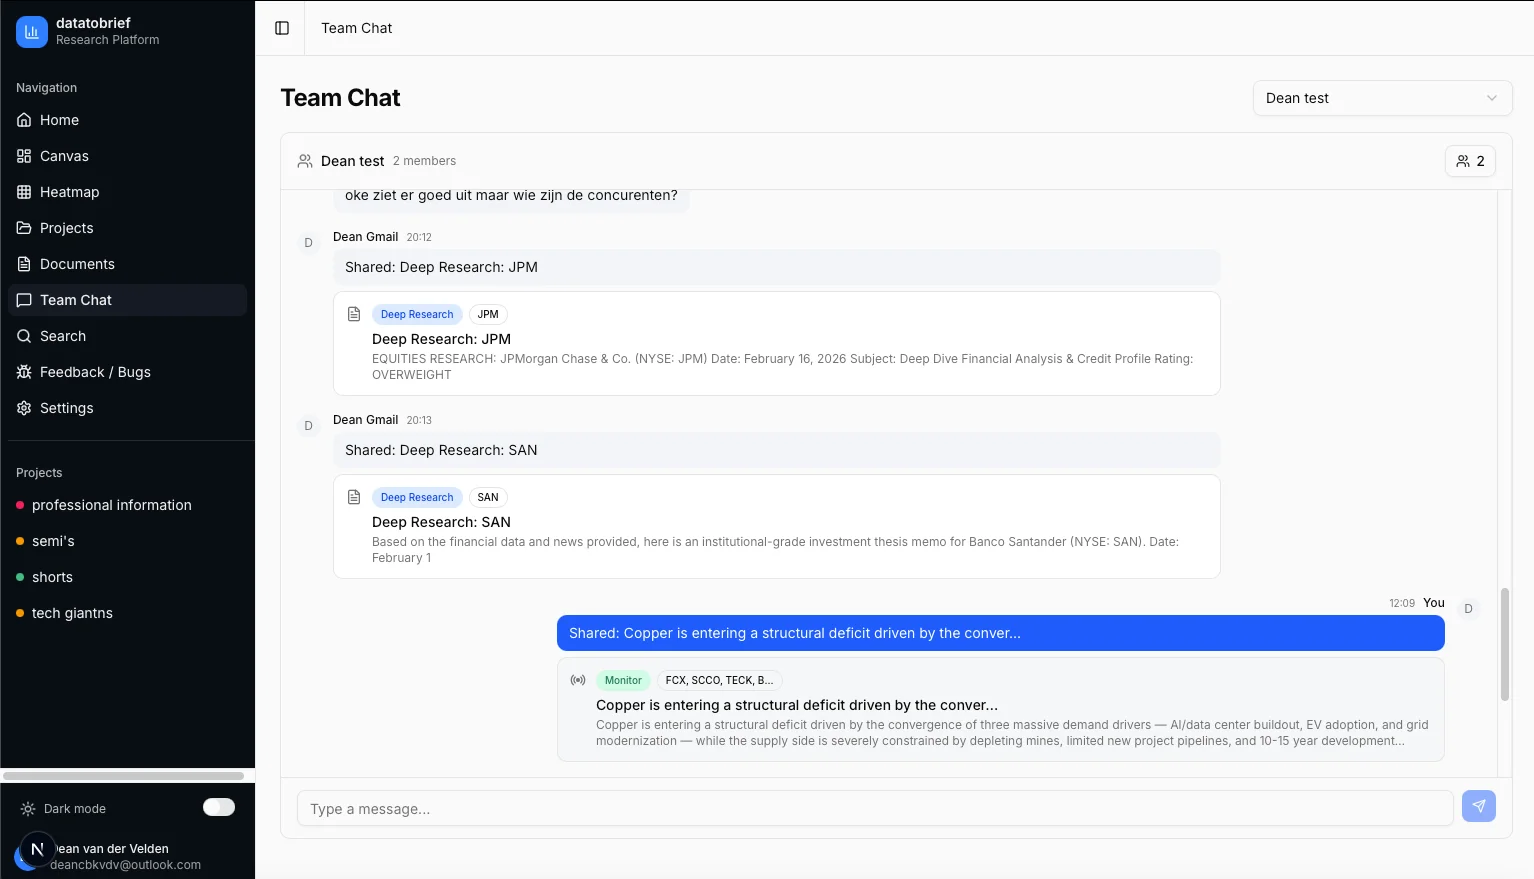
Built for Teams
Invite your team to shared projects, collaborate in real-time, and preserve institutional knowledge. Every piece of research, every monitor update, every document is shareable with one click.
Dedicated project chats and cross-project group chats
Share research reports, monitor alerts, and chat insights with one click
Institutional knowledge preserved — when an analyst leaves, the research stays
Ready?
Ready to see it live?
Get access to the full DataToBrief platform and start transforming your investment research workflow today.
Request AccessReady to transform your research workflow?
Join select investment teams already using DataToBrief.
We respect your privacy. No spam.